
Typeplot - Visual Life Pillar Charts
Turn birth data into visual charts for project alignment and habit building. Ideal for founders and creators seeking data-driven personal insights.
Published on Oct 25, 2025
Visit site
7 upvotes
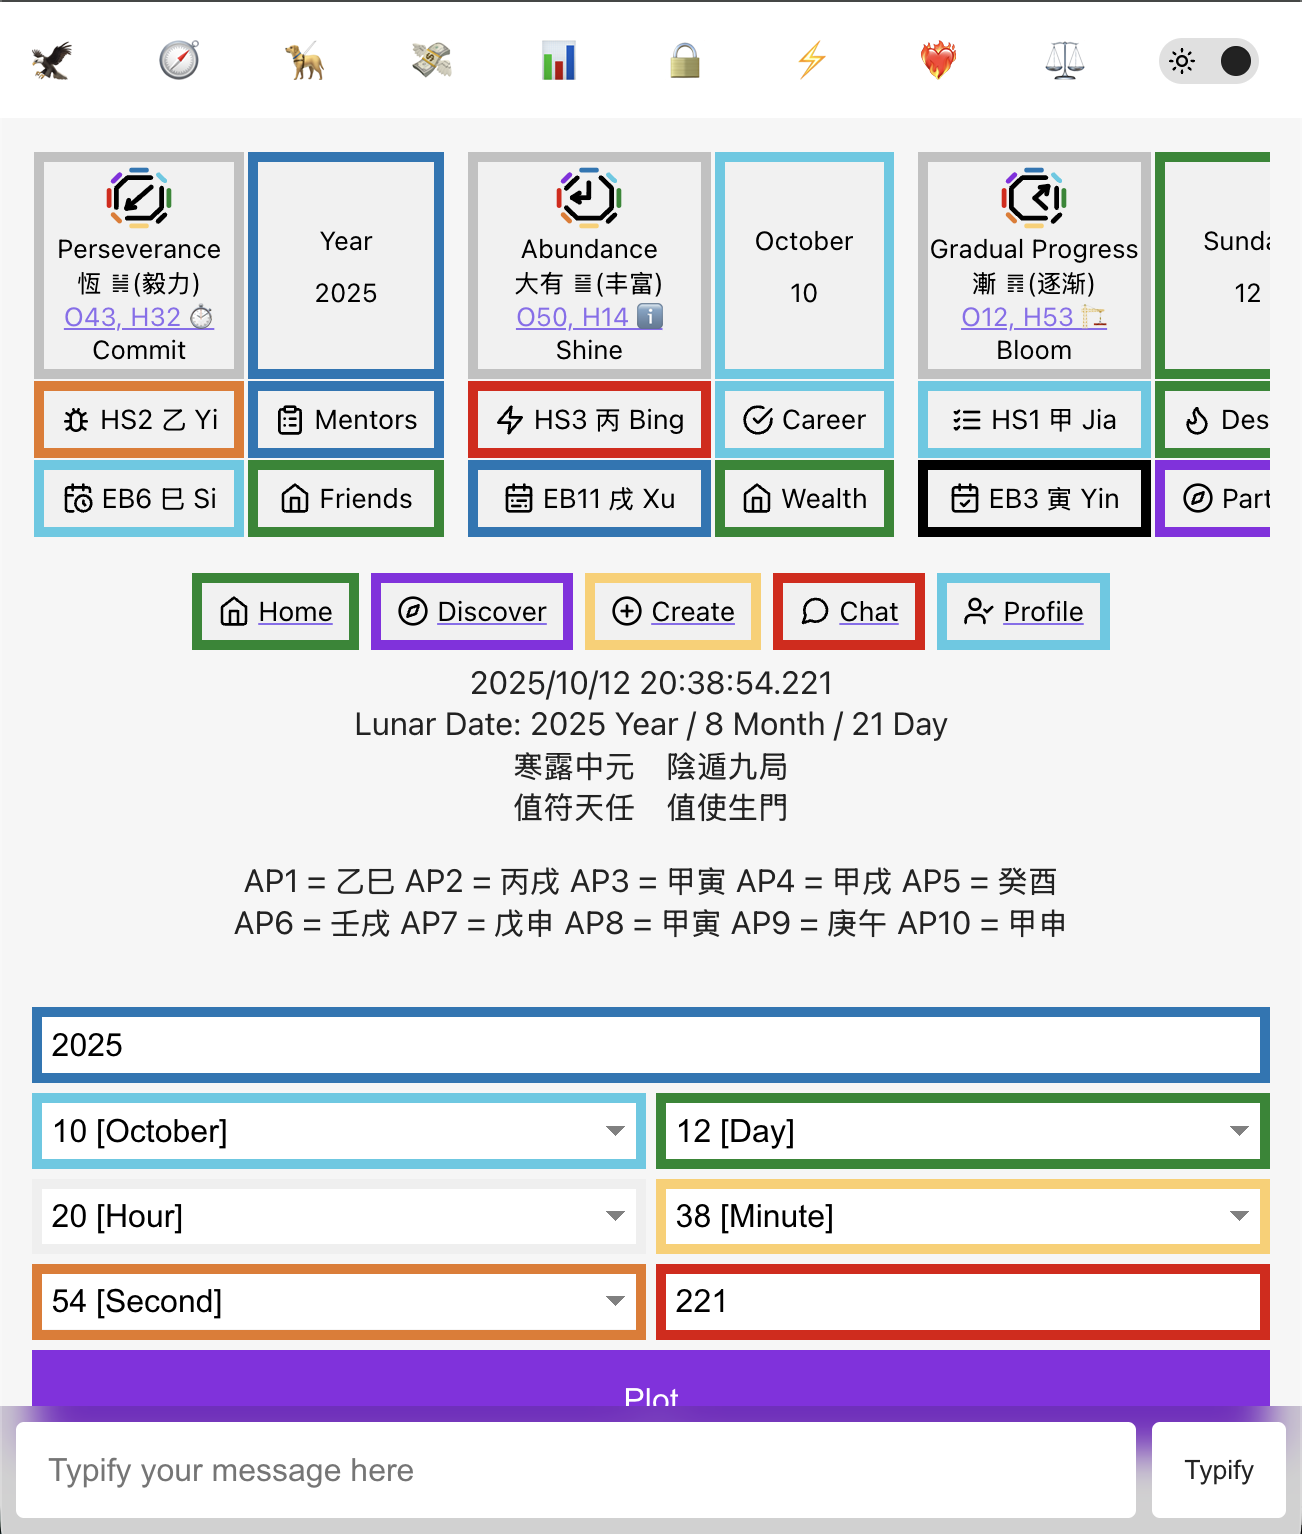
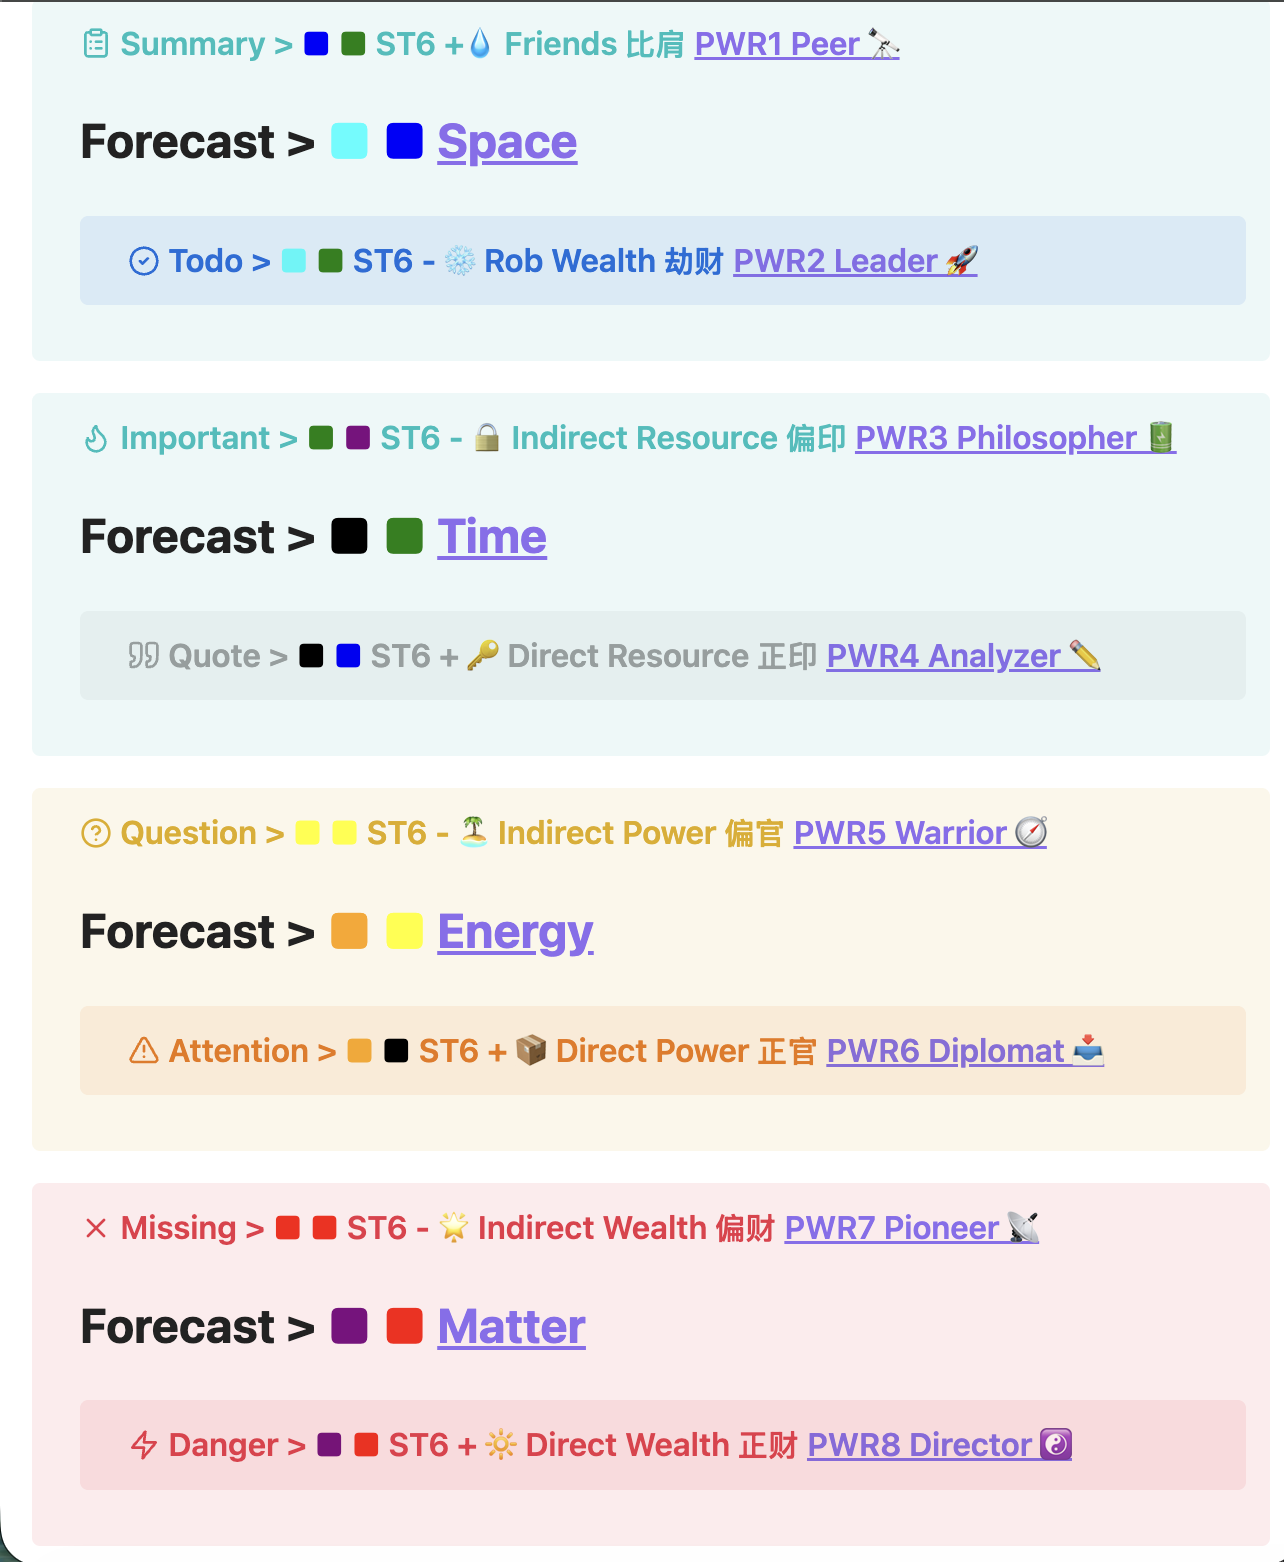
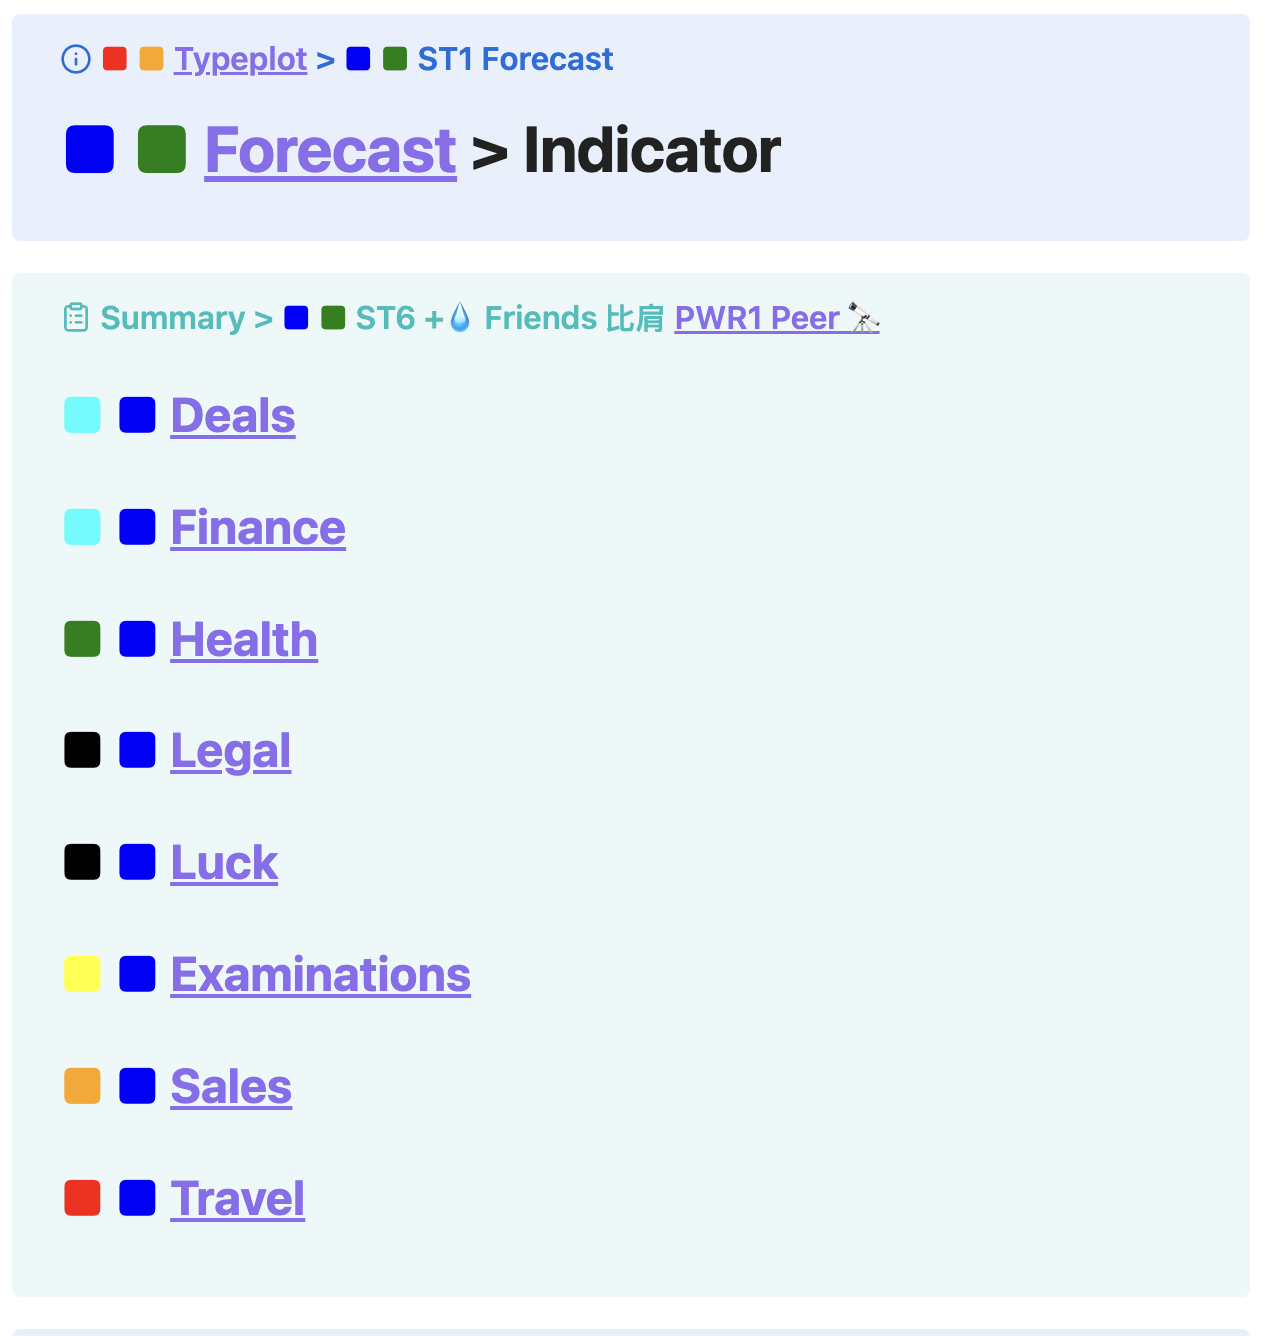
TypePlot transforms your birth date and time into a powerful visual chart that reveals your 10 life pillars — from focus and motivation to relationships and opportunity cycles. It blends data science, ancient metaphysics, and design to help you see yourself and your timing more clearly than ever before. Creators use it to align their projects. Entrepreneurs use it to choose the right moments. Anyone can use it to find direction.
Screenshots (6)
Comments (0)
No comments yet. Be the first!