
Heat Globe - Interactive 3D Data Visualization
Transform complex spatial datasets into interactive 3D representations. A web-based analytics tool for data scientists and designers to gain deeper insights.

Published on Mar 31, 2026
Visit site
3 upvotes
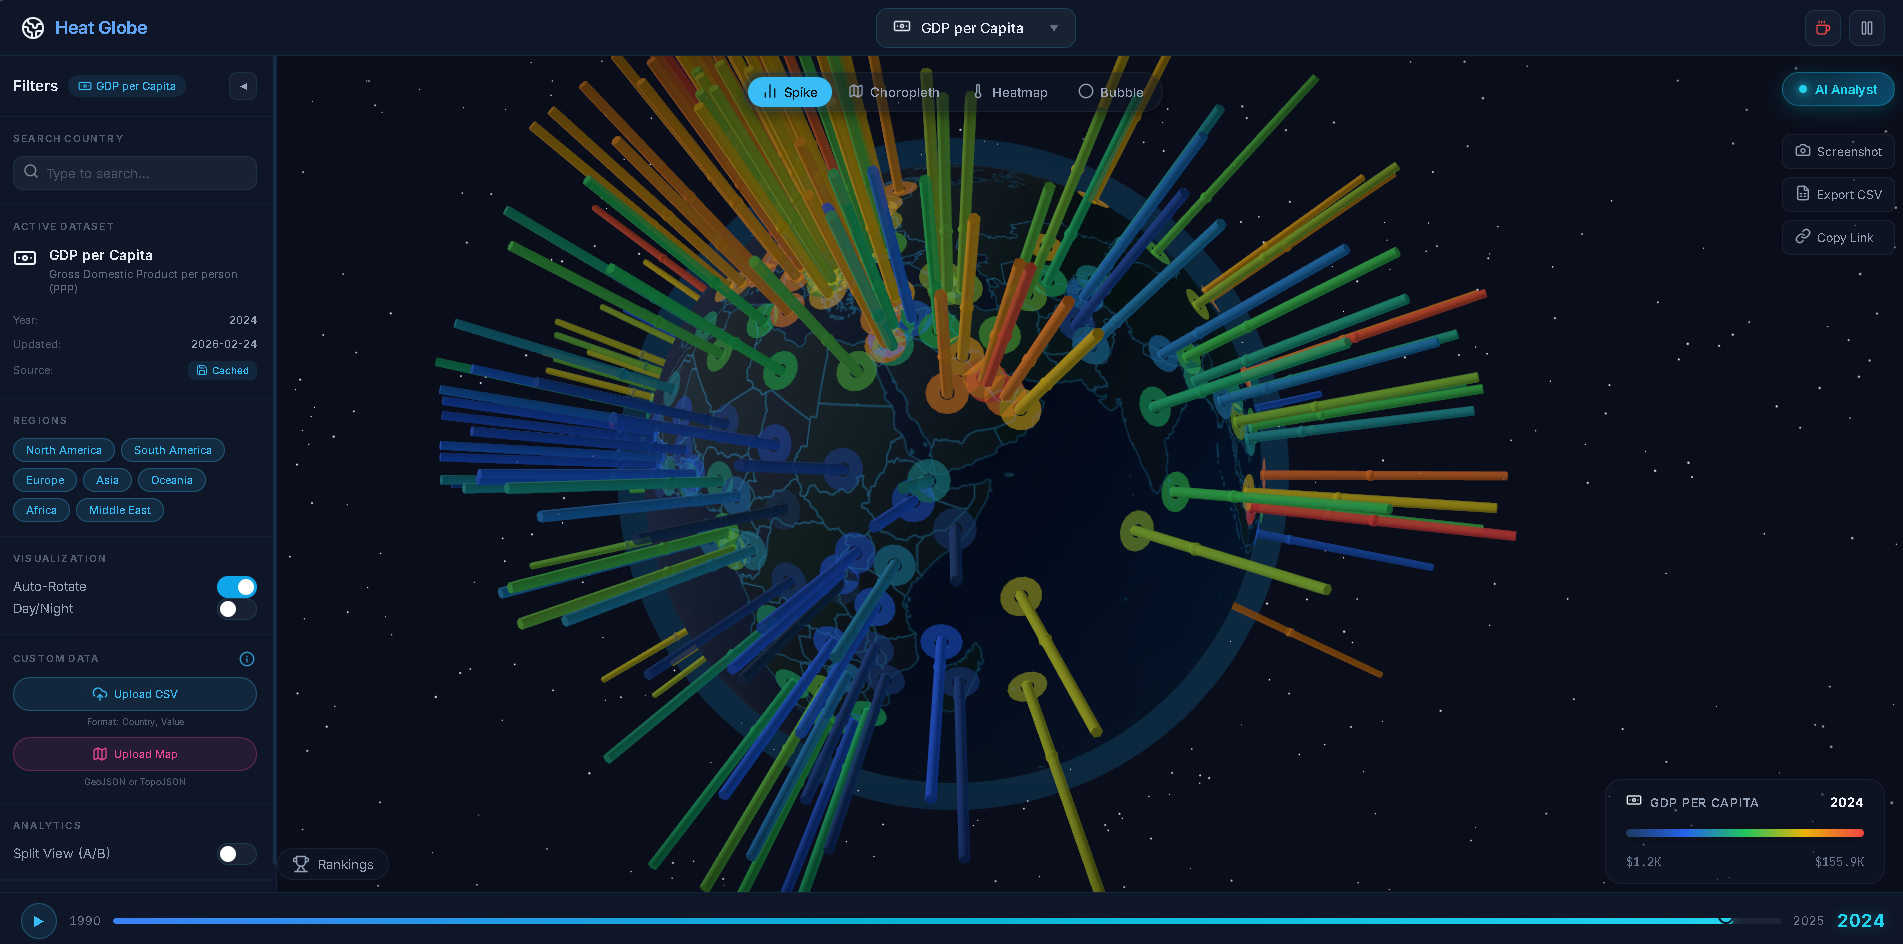
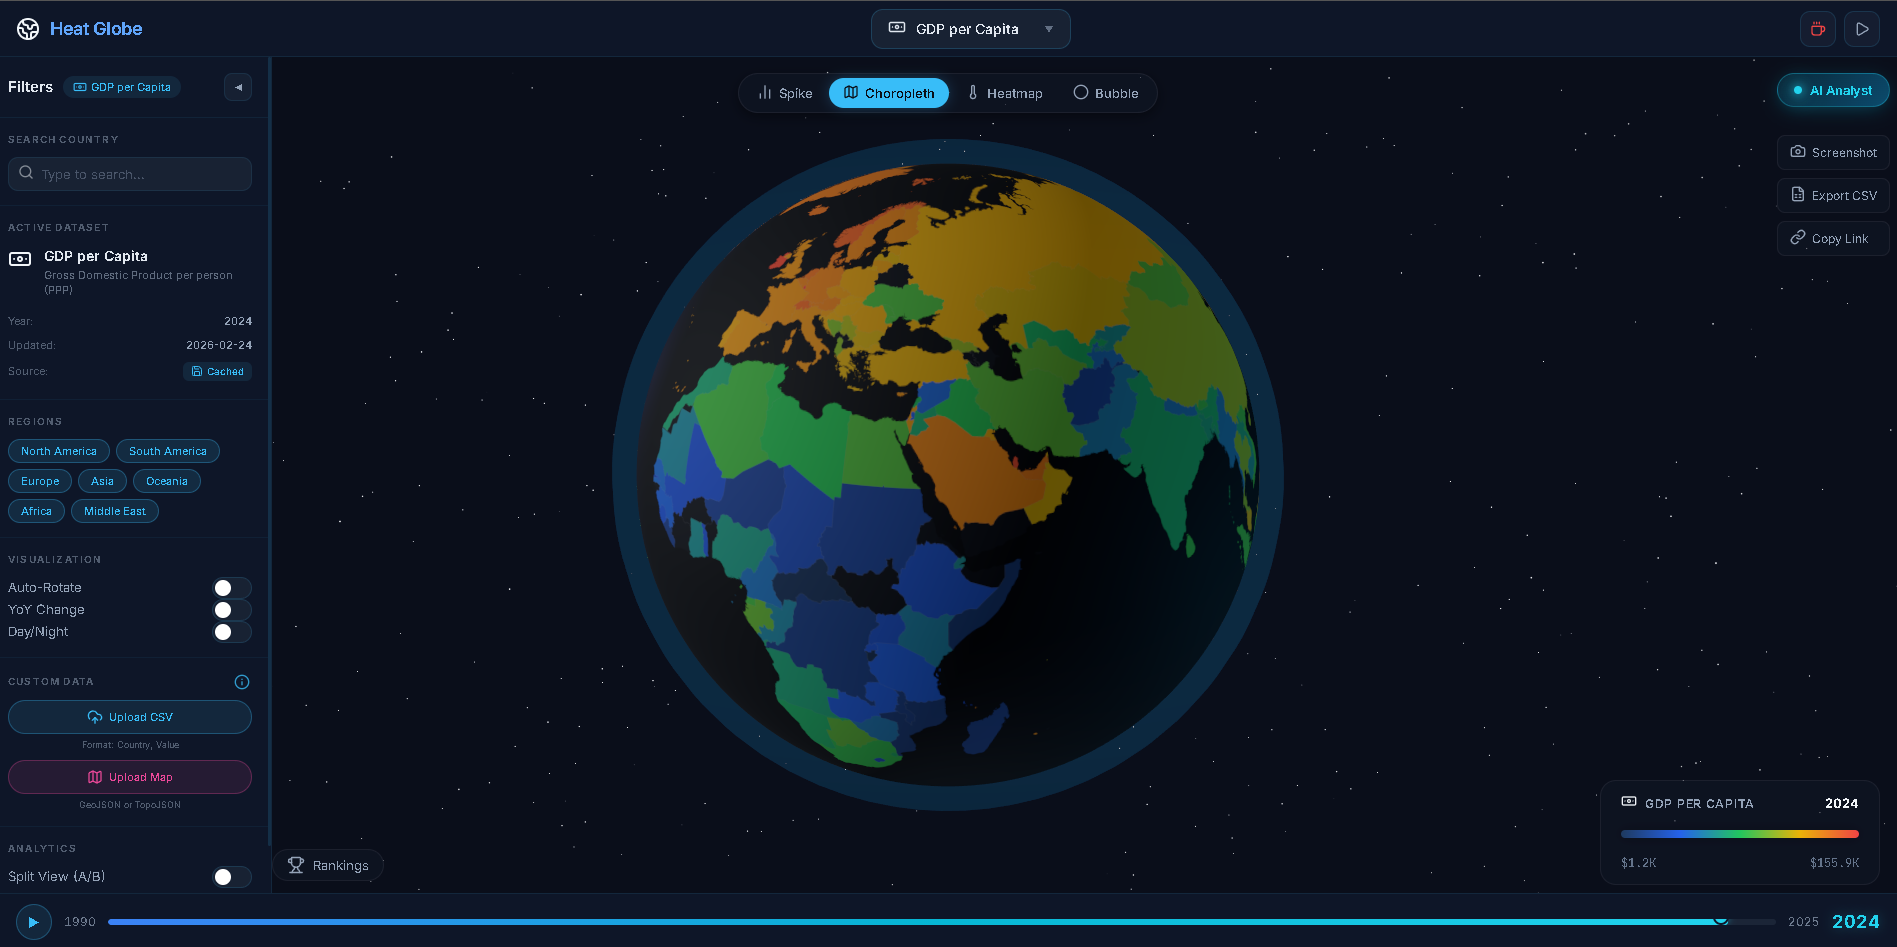
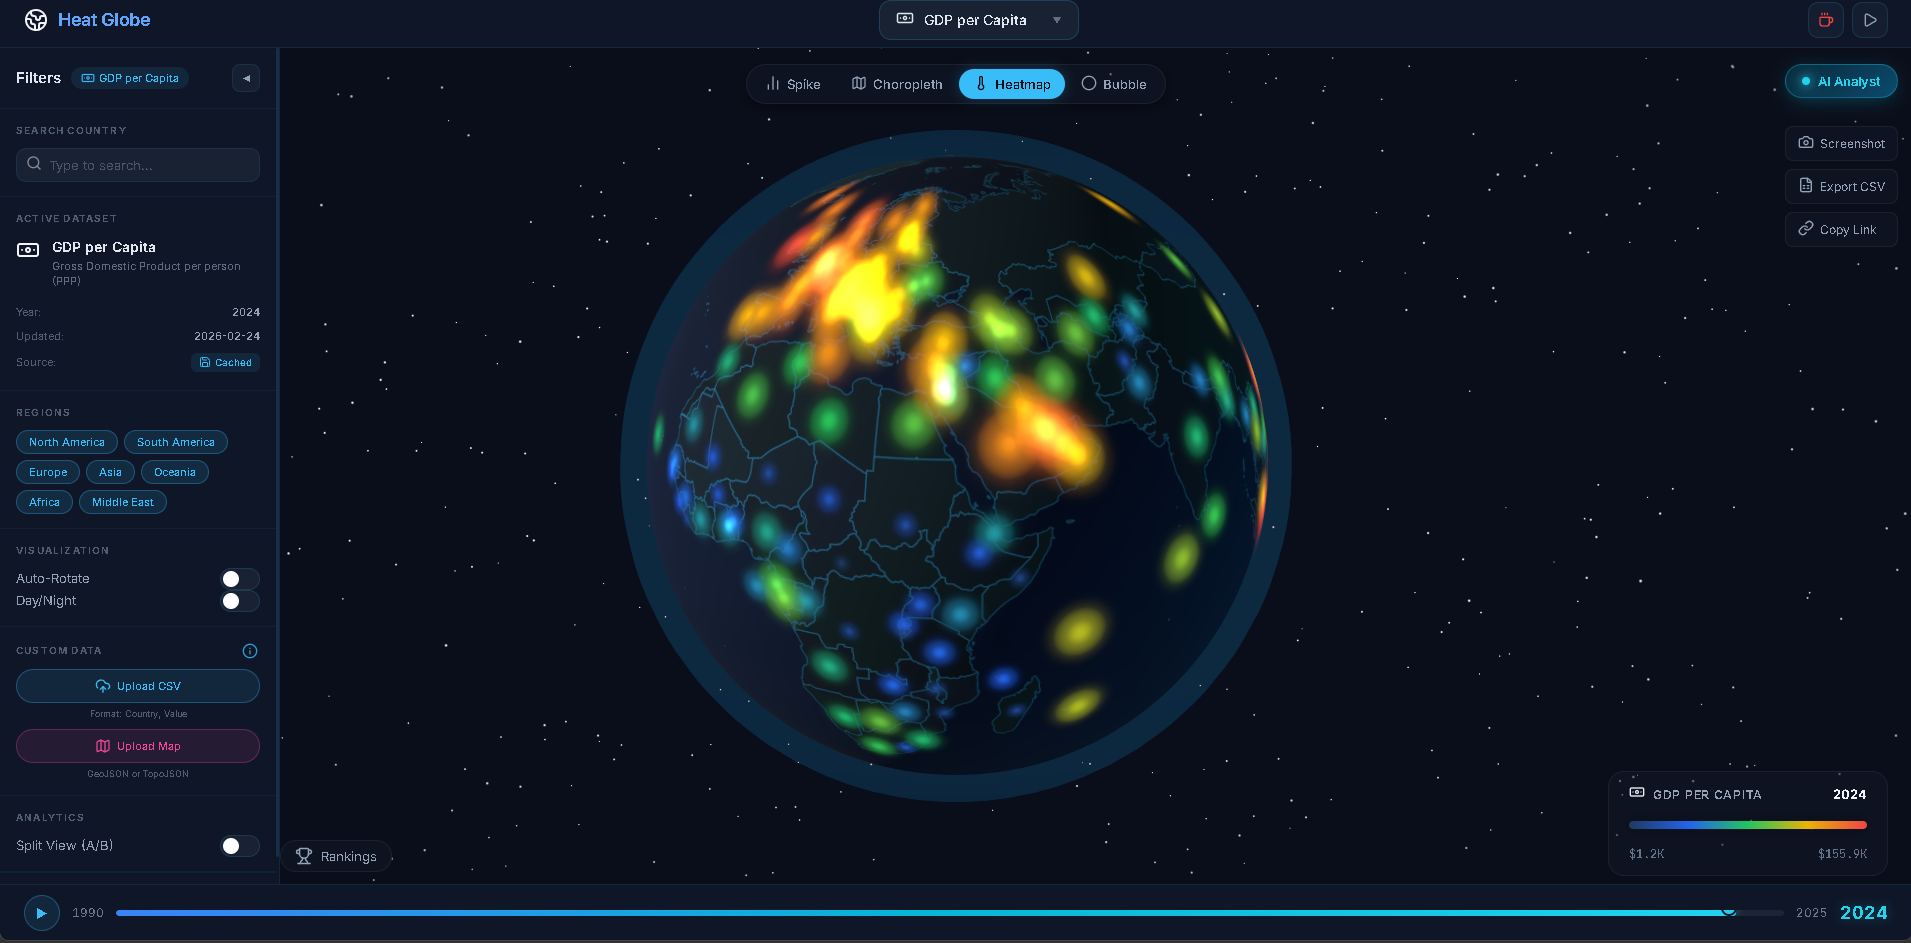
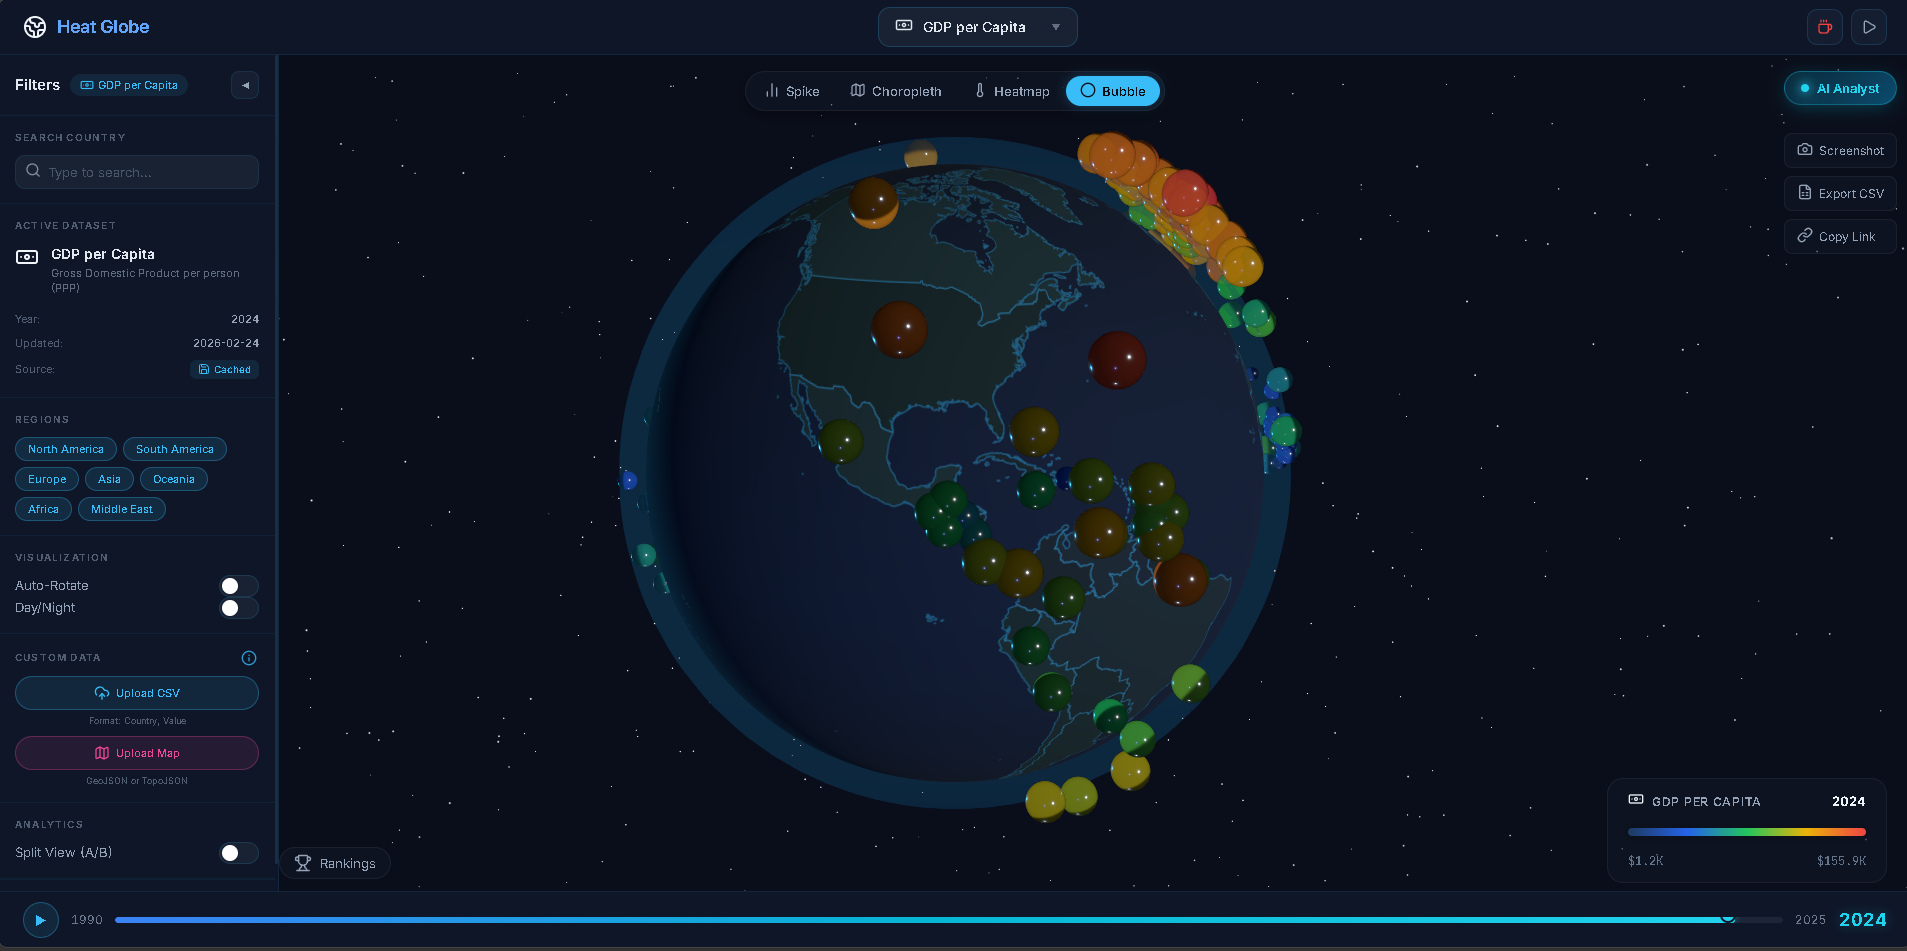
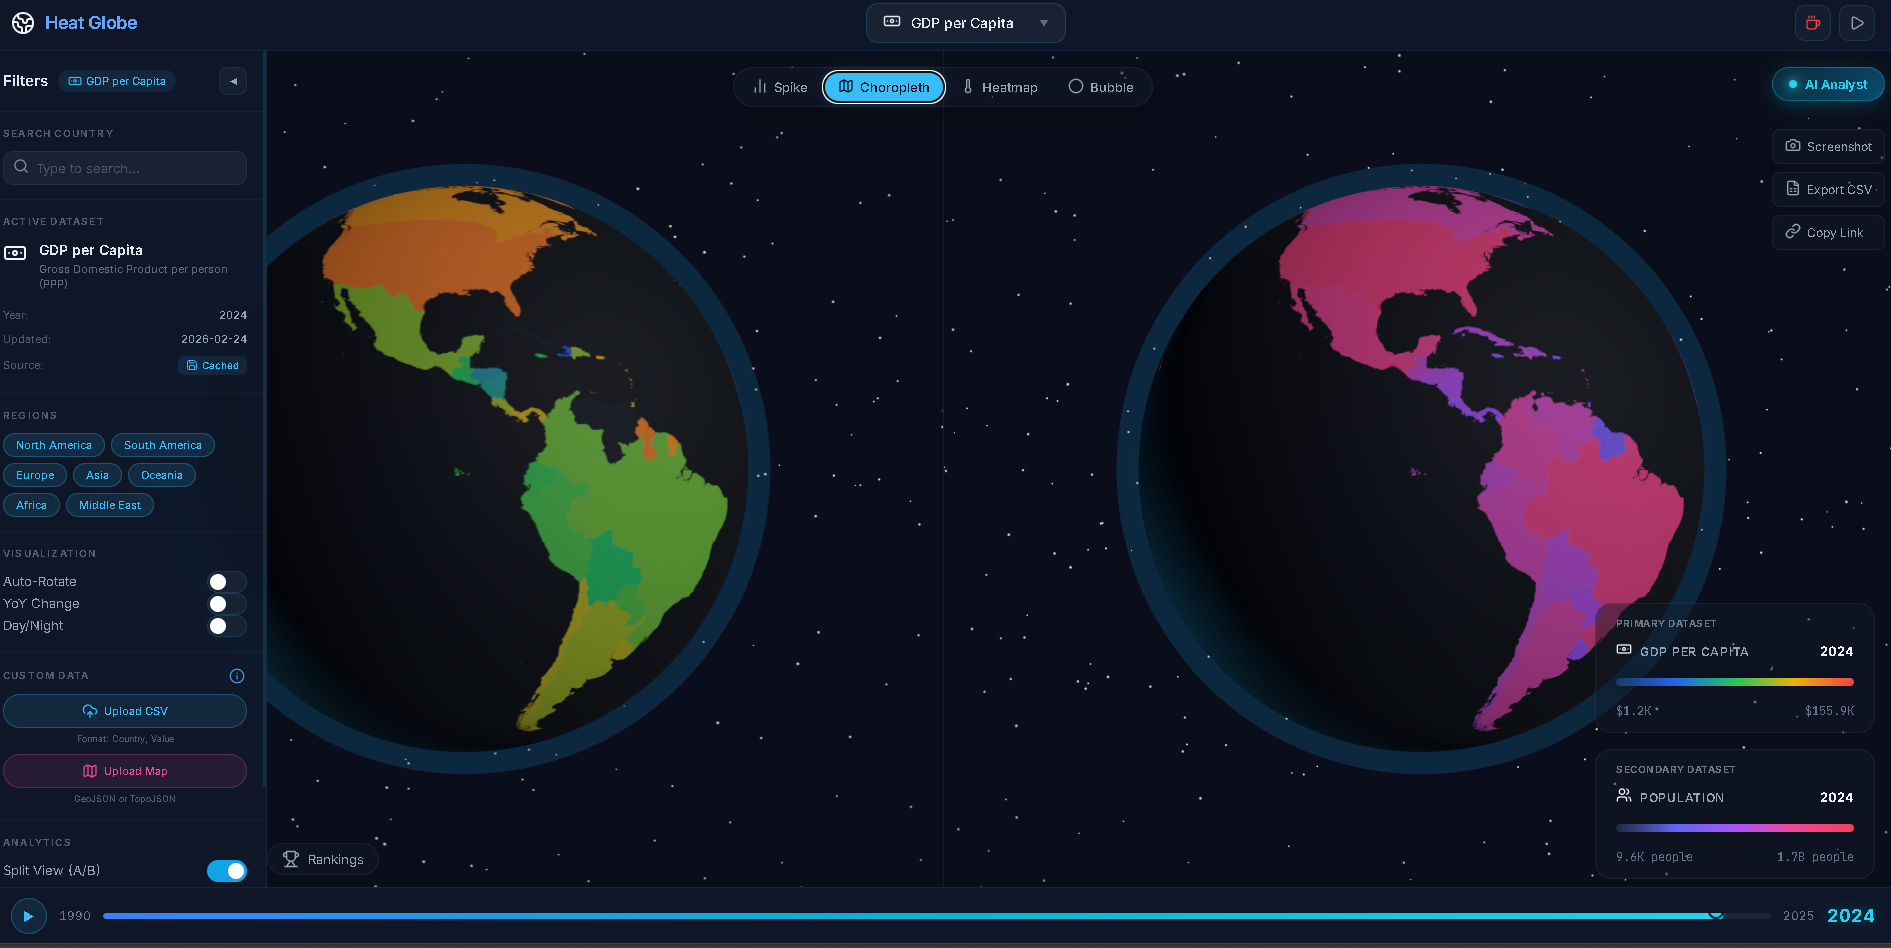
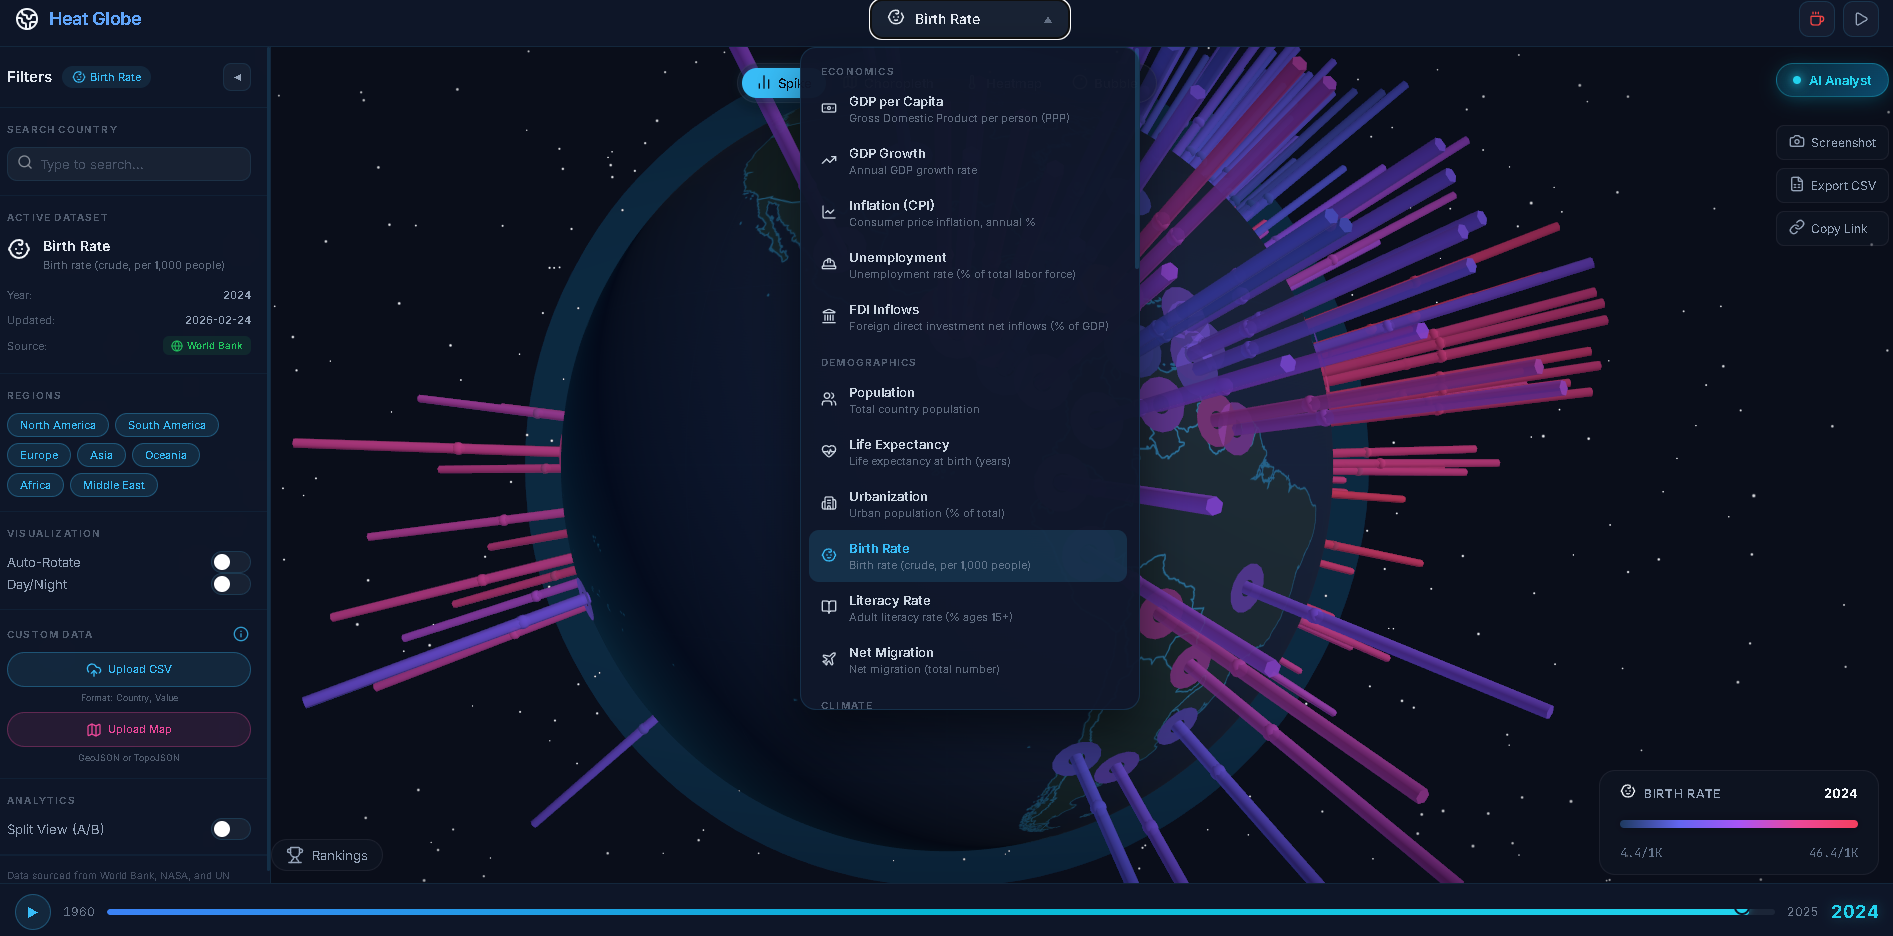
Heat Globe provides an interactive 3D platform designed for data visualization. You can transform complex datasets into immersive globe-based representations, allowing you to explore geographic and spatial information in a dynamic environment. This tool helps you gain deeper insights from your data through its specialized 3D interface.
Screenshots (6)
Comments (0)
No comments yet. Be the first!